Exported Report: Application Performance Capacity Forecast
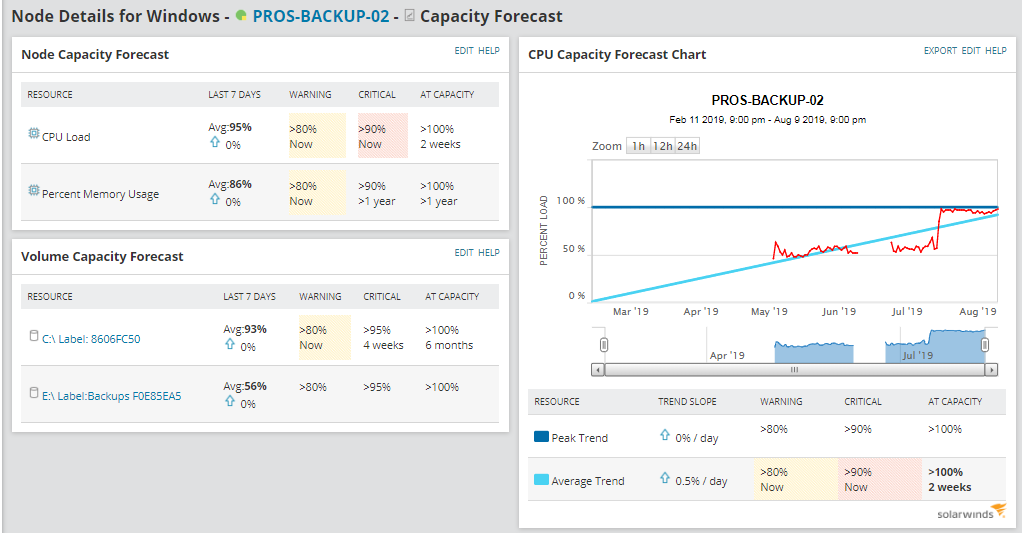
Capacity Forecast is one of the features available in the SolarWinds® Orion platform, that allows you to monitor the trends of some of the main KPIs in your network. However, SolarWinds Orion will not analyse the capacity forecast information for every single metric that is being gathered in the platform.
Available out of the box, only CPU and memory at the node level, interface traffic at the interface level, and disk space used at the volume level are compatible with the capacity forecast feature.
The Problem
There have been situations where I would have loved to get the capacity forecast information for other metrics, especially when analysing future capacity requirements for my applications, but as mentioned before, SolarWinds Orion does not give us that info for every single metric.
This might look like a problem, however, SolarWinds Orion stores the historical data for the whole retention period, i.e. the data is available for us, we just need to create the report to show the data in the format we want.
The Report
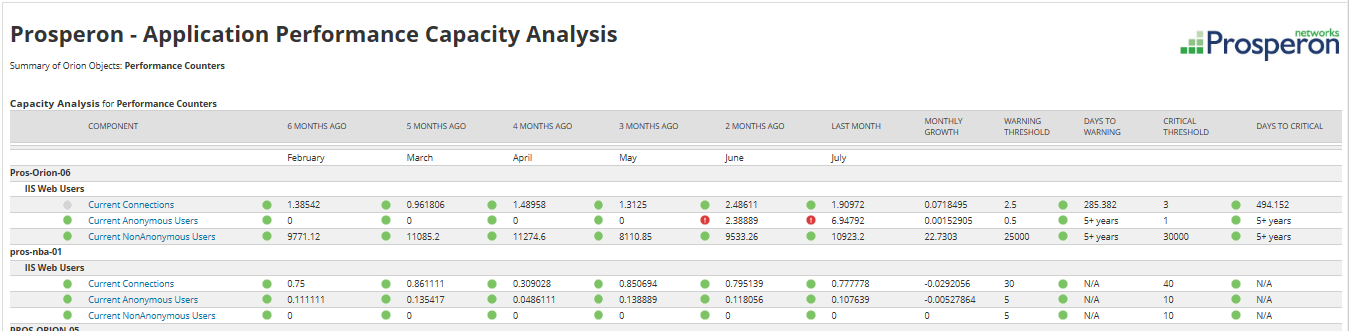
The following custom Orion report displays the capacity forecast analysis of all the performance counters monitors in SolarWinds Server & Application Monitor, showing the average value of that monitor per month for the last 6 months, the average increase/decrease per day, the warning and critical thresholds (if defined) and the amount days left until the metric reaches the threshold.
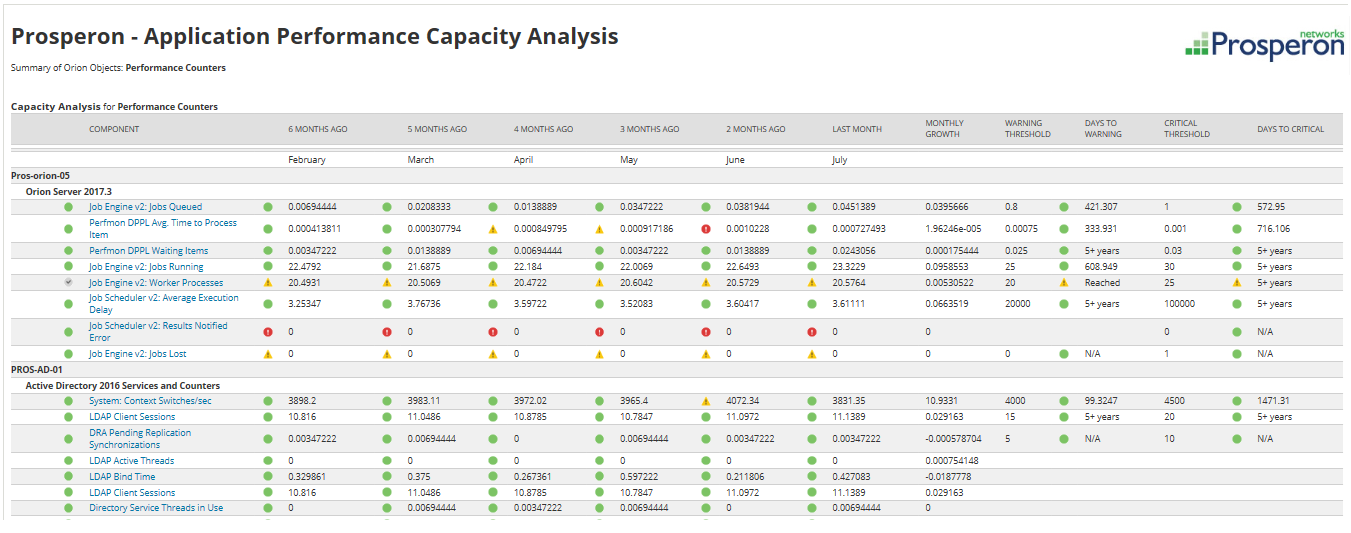
This report may be very useful for lots of customers, however, in big installations of SolarWinds SAM, there might be thousands of performance counters monitors, and some of those monitors maybe not as important as some others.
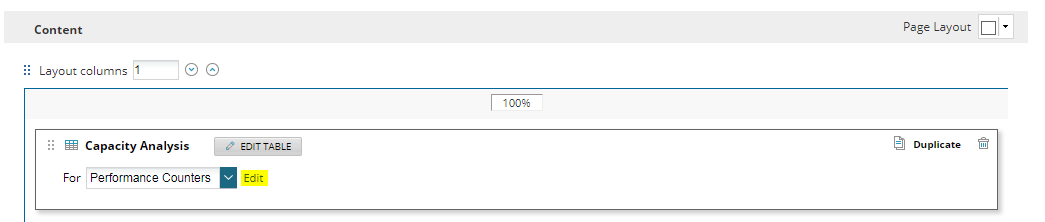
It would be nice if we could filter the performance counters displayed on this report in some way and show only the important ones. We can do this by creating SQL filters with the SQL query used to create this report.
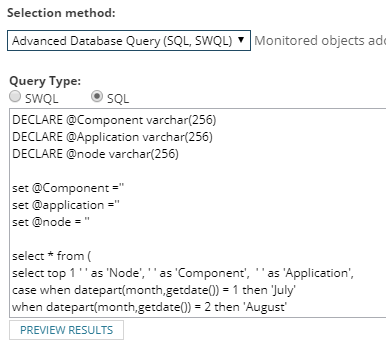
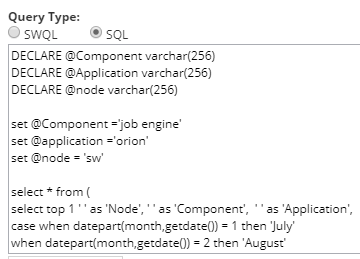
There are three filters that we will use to include the monitors required. In order to edit the filters, we just need to edit the SQL query configured on the data selection of the report.
The three filters used here are and note how I have utilised SQL variables to separate the filter values, which I prefer just to make it easier to define, as it can be edited outside of the SELECT statement:
- @Component: filters by component name
- @Application: filters by application name
- @node: filters by node name
These three filters can be used at the same time if required. As an example, the following configuration would show all the components where the component name contains ‘job engine’ and application name contains Orion and node name contains ‘SW’.
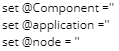
In case you don’t want to use one or more of these filters, just leave the variable with no value (as default).
Real Case
The first time I thought about creating this report was when a SolarWinds customer asked me to create a capacity report that showed the trend of web users on their IIS servers. They wanted to know if their current web servers were currently saturated, and, if they were not, they wanted to know when they will require a new webserver to be added to the pool in order not to impact on the web performance. Typically, a line or bar chart would be used, as this gives a nice clear trend display, but where many lines would be shown, it would make it very difficult to read information out or would require multiple charts. Therefore, a different approach was necessary, hence this report.
In this scenario, we can use this report using the application name filter @application = ‘IIS Web Users’. The ‘IIS Web Users’ application is a custom template I’m using instead of the Appinsight for IIS template due to license restrictions (the NFR licenses are quite small). Otherwise, if you guys are using Appinsight for IIS, I would use the filter @application = ‘Microsoft IIS’ and @component = ‘Current’.
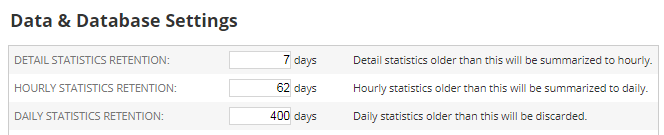
NOTE: the default retention period of SAM is 90 days, which means you will be restricted to this time period of analysis. If you wish to extend it to a period your report requires to cover, this setting can be edited on SAM Settings -> Data and Database Settings. It is important to note, this setting has a significant impact on Database size, as more data is being recorded and therefore please ensure your SQL Server can both store, but more importantly compute resource to allow it to process the higher data volume.
So, if you wish to use a report like this one, please feel free to download the report available below, and please let us know your feedback.
I hope this article has been informative for you and thank you for your time reading it.
Custom Report: Application Performance Capacity Forecast

Raul Gonzalez
Technical Manager
Raul Gonzalez is the Technical Manager at Prosperon Networks. As a Senior SolarWinds and NetBrain Engineer for over seven years, Raul has helped hundreds of customers meet their IT monitoring needs with SolarWinds and NetBrain Solutions.
Custom Report: Application Performance Capacity Forecast
Enhance Database Monitoring with SolarWinds SQL Sentry
Recent Improvements to SQL Sentry In the fast-paced world of database management, staying on top of performance monitoring and optimisation is crucial. Database...
Database in Distress – important Database metrics on one screen with SolarWinds
Webinar: Database in Distress How to understand important Database metrics on one screen with SolarWindsIn this Webinar on Monday 5th June, you will discover how SolarWinds®...
Webinar On-Demand: SolarWinds Database Monitoring – Actual Bona Fide Database Administrators
In this webinar, you will discover how SolarWinds® can help Database Administrators to meet their advancing Database monitoring and configuration challenges. This webinar...